Regression
Information
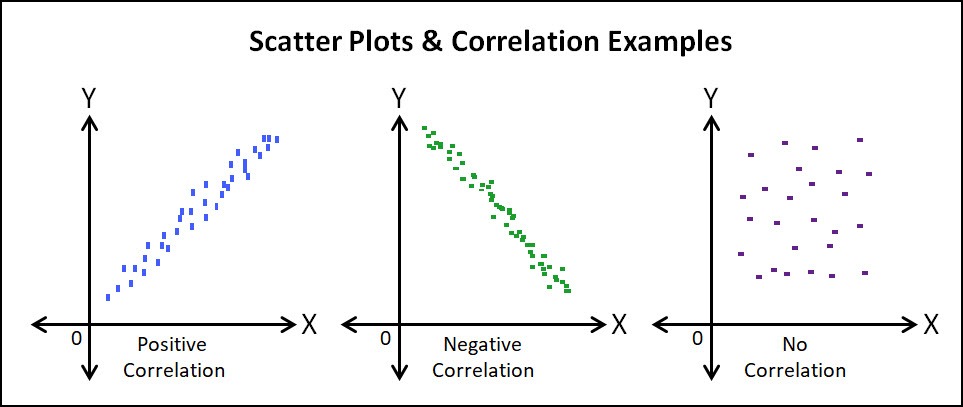
In order to learn about Regression we first need to understand a key words:
Bivariate Data - Data collected as a pair e.g.Height and Weight
Usually one variable controlled (x) and one measured experimentally (y)
(x - Independant, y - Dependent)
In order to show the mean of variables of x and y we use:
$$\bar{x}, \bar{y}$$
We expect the Line of Best Fit (LOBF) to go through the mean point
$$(\bar{x}, \bar{y})$$
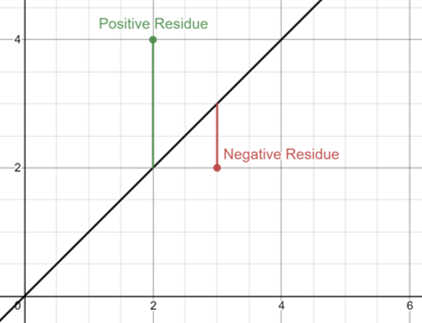
We use a least squares regression line of y upon x in order to minimise the sum of the squares of the residuals (See graph below)
We want these squares to be as small as possible meaning the distance between the line and all the points are as small as they can possibly be giving us the best LOBF
This is called the regression line which is the best possible LOBF (minimal squared residuals)
We know from previous knowledge that a line can be represented by the equation:
y = mx + c
However in statistics we use the equation:
y = a + bx
(where a=c and a=m)
We know however that the LOBF goes through the mean point so we can replce the value of x and y with there mean values giving us the new equation:
$$\bar{y} = a + b\bar{x}$$
Or re-arranged
$$a = \bar{y} - b\bar{x}$$
We can find b using the equation:
$$b = \frac{S_{xy}}{S_{xx}}$$
Now we just need to use the equations for Sxy and Sxx (where n is the number of points)
$$S_{xx} = \sum{(x-\bar{x})^2} ≡ \sum{x^2} - \frac{(\sum{x})^2}{n}$$
$$S_{xy} = \sum{(x-\bar{x})(y-\bar{y})} ≡ \sum{xy} - \frac{(\sum{x})(\sum{y})}{n}$$
Example
Find the regression line of the points:
(0,2.4), (1,4.3), (2,5.2), (3,6.8), (4,9.1), (5,11.8)
| x | y | $$x^2$$ | xy |
| 0 | 2.4 | 0 | 0 |
| 1 | 4.3 | 1 | 4.3 |
| 2 | 5.2 | 4 | 10.4 |
| 3 | 6.8 | 9 | 20.4 |
| 4 | 9.1 | 16 | 36.4 |
| 5 | 11.8 | 25 | 59 |
$$\sum{x} ≡ 0+1+2+3+4+5 = 15$$
$$\sum{y} ≡ 2.4+4.3+5.2+6.8+9.1+11.8 = 39.6$$
$$\sum{x^2} ≡ 0+1+4+9+16+25 = 55$$
$$\sum{xy} ≡ 0+4.3+10.4+20.4+36.4+59 = 130.5$$
$$S_{xy} = \sum{xy} - \frac{(\sum{x})(\sum{y})}{n} = 130.5 - \frac{15×39.6}{6} = 31.5$$
$$S_{xx} = \sum{x^2} - \frac{(\sum{x})^2}{n} = 55 - \frac{15^2}{6} = 17.5$$
$$b = \frac{31.5}{17.5} = 1.8$$
To find the mean we take the total some of x and y seperately and divide them by the number of data points
$$\bar{x} = \frac{\sum{x}}{n} = \frac{15}{6} = 2.5$$
$$\bar{y} = \frac{\sum{y}}{n} = \frac{39.6}{6} = 6.6$$
Therefore using the equation we have learned before we can see that:
$$a = \bar{y} - b\bar{x} = 6.6 - (1.8)(2.5) = 2.1$$
We can then get the final equation:
y = a + bx
y = 2.1 + 1.8x
Example 2
Find the regression line of the points:
(1,4.5), (2,6.0), (3,7.7), (4,7.3), (5,9.1), (6,8.6), (7,10.6), (8,10.2)
| x | y | $$x²$$ | xy |
| 1 | 4.5 | 1 | 4.3 |
| 2 | 6.0 | 4 | 36.0 |
| 3 | 7.7 | 9 | 59.29 |
| 4 | 7.3 | 16 | 53.29 |
| 5 | 9.1 | 25 | 82.81 |
| 6 | 8.6 | 36 | 73.96 |
| 7 | 10.6 | 49 | 112.36 |
| 8 | 10.2 | 64 | 104.04 |
$$n = 8$$
$$\bar{x} = 4.5$$
$$\bar{y} = 8$$
$$\sum{x} = 36$$
$$\sum{y} = 64$$
$$\sum{x^2} = 204$$
$$\sum{xy} =321.7$$
$$S_{xy} = \sum{xy} - \frac{(\sum{x})(\sum{y})}{n} = 321.7 - \frac{36×64}{8} = 33.7$$
$$S_{xx} = \sum{x^2} - \frac{(\sum{x})^2}{n} = 204 - \frac{36^2}{8} = 42$$
$$b = \frac{33.7}{42} = 0.8024$$
Therefore using the equation we have learned before we can see that:
$$a = \bar{y} - b\bar{x} = 8 - (0.8024)(4.5) = 4.389$$
We can then get the final equation:
y = a + bx
y = 4.39 + 0.802x
Using this equation predict y when:
x = 3.5
y = 4.39 + (0.8024)(3.5) = 7.20
x = 11
y = 4.39 + (0.8024)(11) = 13.21
Comment on the accuracy of these results using the points given in the question
x = 11 will be less accurate as it is outside of a=our data range meaning it is Extrapolated
x = 3.5 should be reasonably accurate as it lies between our data range therefore it is Interprelated
Taking Information from the regression line Equation
If we have the regression line:
y = 16 + 0.115x
(where y = hours of time taken and x = area painted)
Then the regression line has an intercept of 16
and 0.115 is how quickly x increases in comparison with y
Given the point H(480,70) what is the residual for H
y = 16 + 0.115x = 16 + 0.115(480) = 71.2
Residual = 70 - 71.2 = -1.2
This means that the data point is 1.2 units away from the regression line
If someone is payed £12 per hour to paint an area of 560m²
How much will they be payed using the regression line
Replacing the value of x with the area being painted we find that:
y = 16 + (0.115)(560) = 80.4 minutes
y = 80.4/60 hours taken
We know that the person is being payed £12 per hour and works for 80.4/60 hours meaning they have earned
£12 × (80.4/60) = £16.08