Hypothesis Testing Correlation Coefficient
Information
Hypothesis testing is used to measure the reliability and the reliability of a statement making sure that what has been stated is true to a certain range
Null Hypothesis -
$$(H_0)$$
Alternative Hypothesis -
$$(H_1)$$
Significance level - Probability
$$(H_0)$$
rejected even though it is true (normally a 5% or 10% chance)
Testing statistics - PMCC and Spearman
Critical Value - The value you test at to check whether or not to reject the hypothesis
Critical Region - The region in which you reject the hypothesis
Acceptance Region - The range of values for which you accept the hypothesis
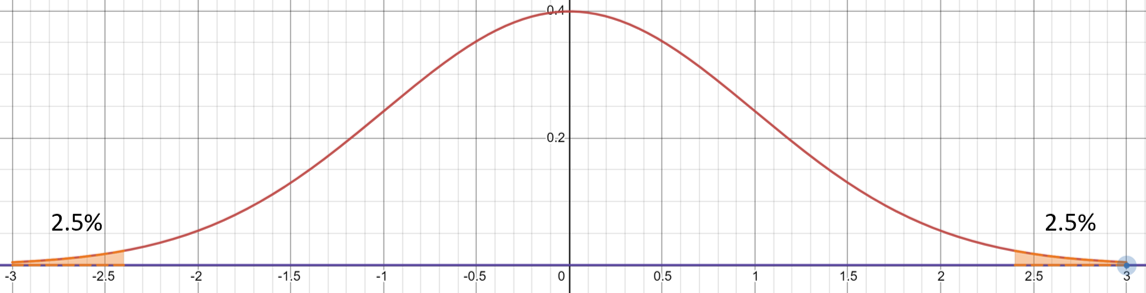
For a 2 tail test we are checking to see if the value lies within the middle of the graph by using:
$$H_0:p=0$$
$$H_1:p≠0$$
This image shows a test at 5% meaning that there will be 2.5% on each end of the graph
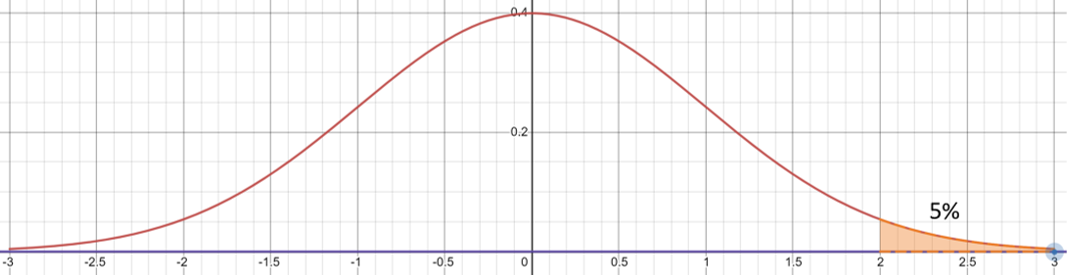
For a 1 tail test we check to see if the value is either larger or less than 0 depending on the value you are looking for
$$H_0:p=0$$
$$H_1:p < 0 \ or \ H_1:p > 0$$
This image shows a test for 5% with the alternate hypothesis being p>0
When p = 0
Using pages 32-35 of this worksheet answer the following question
We recommend you print these pages of for use in other lessons however this booklet will be provided to you in an exam so you won't need to bring it with you
Questions
Where n is the amount of data, and n=10 conduct a 1 tail test for pmcc at the 5% level using the hypothesis
$$H_0:p=0$$
$$H_1:p>0$$
Find the Critical Region
Using the tables from the link below on page 32 we can see that for a 1 tail test at 5% and n=10 we get the value of 0.5494
This is the critical value
Using this we know that the critical region is r>0.5494
This means we reject H0 if r>0.5494