Correlation
Information
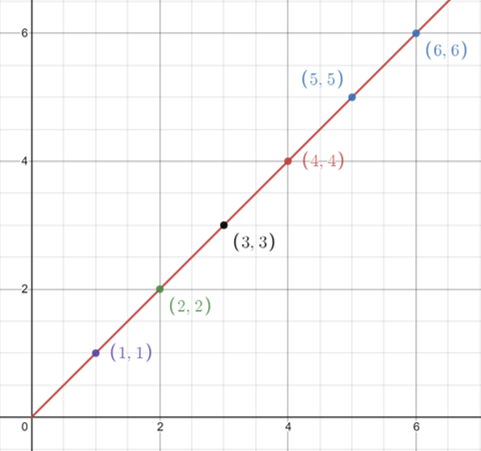
Correlation means how well thee data fits to a straight line (e.g.How close data points are to the LOBF [Line of Best Fit])
If the data fits to a curve do not use the product moment correlation coefficient r as we are only checking for a straight line
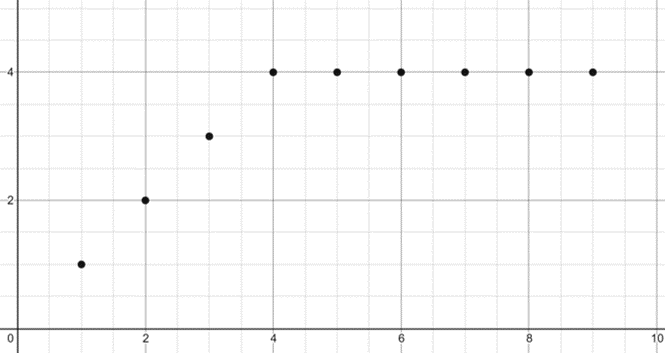
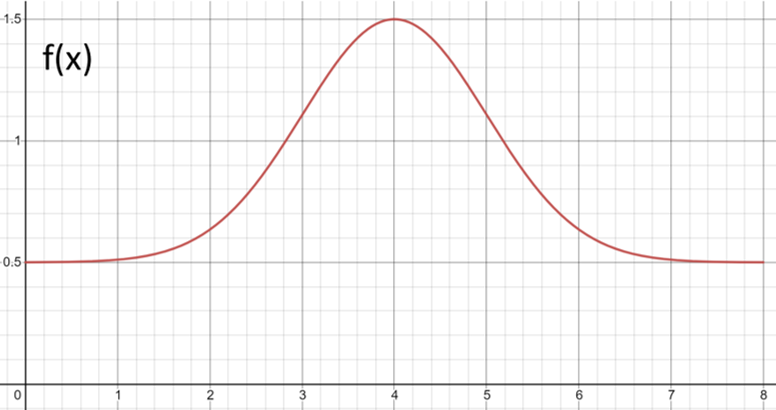
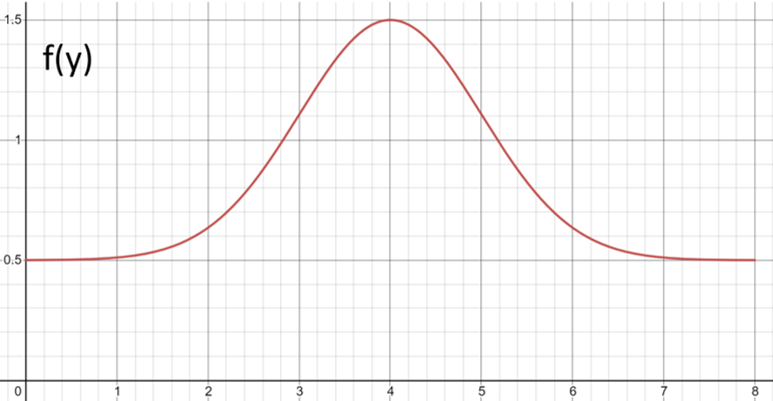
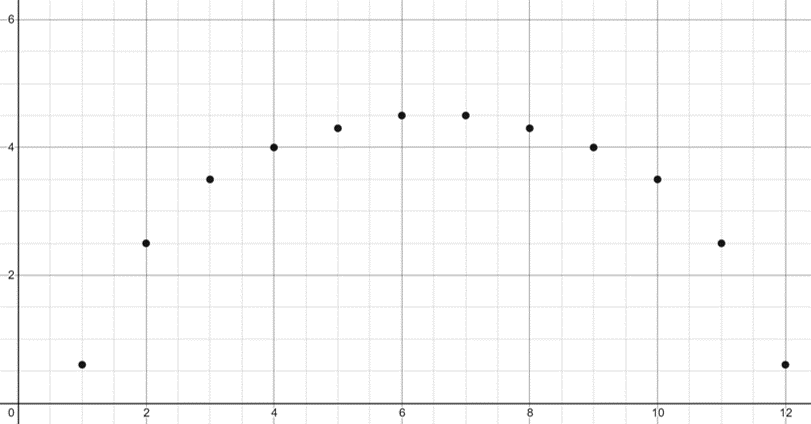
In order for correlation to work data must be jointly normally distributed this means that the majority of all data is centered around the mean as shown in the diagram below where for variable x and y most data is focused around the central point and then as you are further from the mean there are less data points
(Graphs shows amount of data points againt variable)
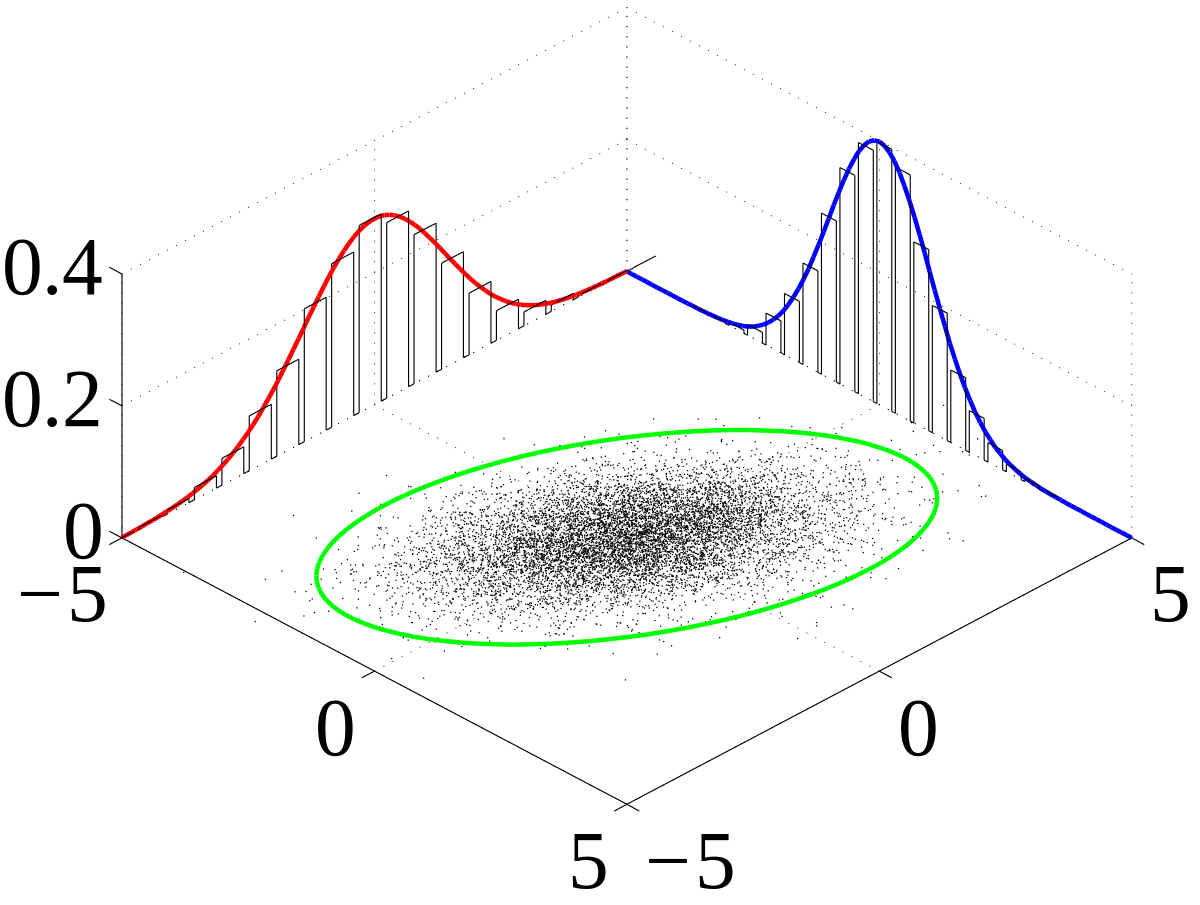
Combining these two graphs into a 3-D graph we can see that all data points are centred about one point as shown in the graph below
In order to find the value for r (product moment correlation coefficient) we must use this equation:
$$r = \frac{S_{xy}}{\sqrt{S_{xx}S_{yy}}}$$
From previous knowledge we know how to find two of these values but as they are so important we will show you there equation once more:
(Where n is the number of data point)
$$S_{xx} = \sum{(x-\bar{x})^2} ≡ \sum{x^2} - \frac{(\sum{x})^2}{n}$$
$$S_{yy} = \sum{(y-\bar{y})^2} ≡ \sum{y^2} - \frac{(\sum{y})^2}{n}$$
$$S_{xy} = \sum{(x-\bar{x})(y-\bar{y})} ≡ \sum{xy} - \frac{(\sum{x})(\sum{y})}{n}$$
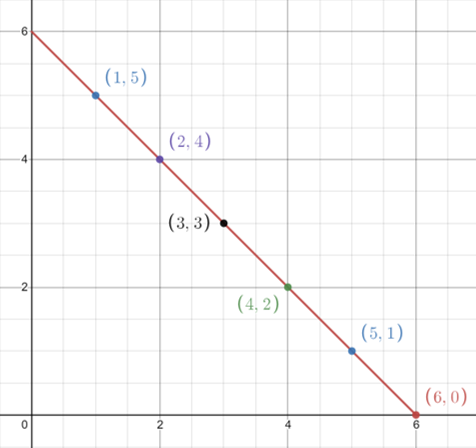
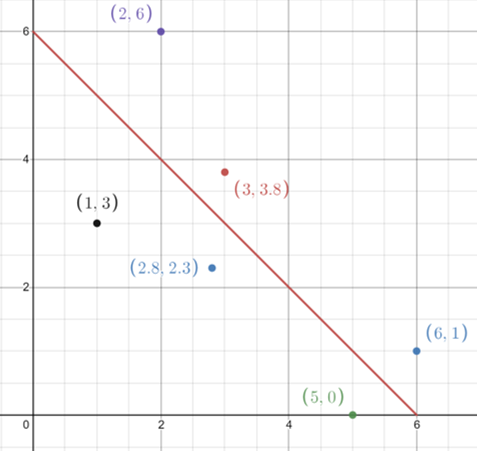
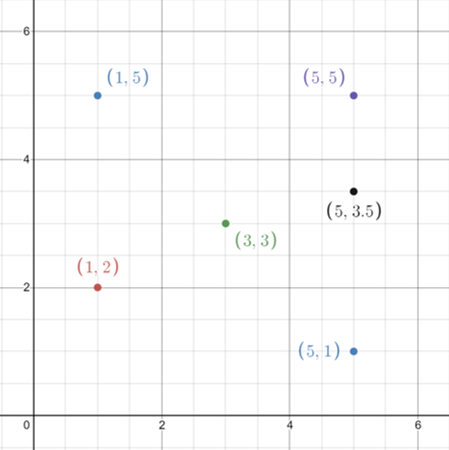
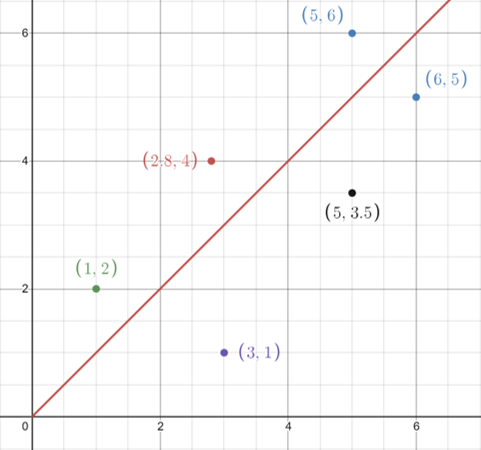
We can represent r on a scale to correspond its value to how we would see the correlation on a graph like so:
| -1.0 | -0.5 | 0 | +0.5 | +1 |
| Perfect Negative Correlation | Moderate Negative Correlation | No Correlation | Moderate Positive Correlation | Perfect Positive Correlation |
 |
 |
 |
 |
 |
Product Moment Correlation Coefficient (r)
Now let us show an example of finding the Product Moment Correlation Coefficient (r)
Example 1
Given the data points:
| x | y | $$x²$$ | $$y²$$ | xy |
| 5 | 240 | 25 | 57600 | 1200 |
| 5 | 232 | 25 | 53824 | 1160 |
| 7 | 227 | 49 | 51529 | 1589 |
| 8 | 222 | 64 | 49284 | 1776 |
| 10 | 215 | 100 | 46225 | 2150 |
$$n = 8$$
$$\sum{x} = 35$$
$$\sum{y} = 1136$$
$$\sum{x^2} = 263$$
$$\sum{y^2} = 258462$$
$$\sum{xy} = 7875$$
$$S_{xy} = \sum{xy} - \frac{(\sum{x})(\sum{y})}{n} = 7875 - \frac{35×1136}{5} = -77$$
$$S_{xx} = \sum{x^2} - \frac{(\sum{x})^2}{n} = 263 - \frac{35^2}{5} = 18$$
$$S_{yy} = \sum{y^2} - \frac{(\sum{y})^2}{n} = 258462 - \frac{1136^2}{5} = 362.8$$
$$r = \frac{S_{xy}}{\sqrt{S_{xx}S_{yy}}} = \frac{-77}{\sqrt{18×362.8}} = -0.953$$
This means thats these two data sets have a very strong negative correlation
Example 2
| x | y |
| 4 | 8 |
| 10 | 6 |
| 9 | 10 |
| 7 | 5 |
| 6 | 8 |
| 5 | 4 |
| 7 | 8 |
| 9 | 9 |
| 8 | 7 |
| 6 | 4 |
$$n = 10$$
$$\sum{x} = 71$$
$$\sum{y} = 69$$
$$\sum{x^2} = 537$$
$$\sum{y^2} = 515$$
$$\sum{xy} = 502$$
$$S_{xy} = \sum{xy} - \frac{(\sum{x})(\sum{y})}{n} = 502 - \frac{71×69}{10} = 12.1$$
$$S_{xx} = \sum{x^2} - \frac{(\sum{x})^2}{n} = 537 - \frac{71^2}{10} = 32.9$$
$$S_{yy} = \sum{y^2} - \frac{(\sum{y})^2}{n} = 515 - \frac{69^2}{10} = 38.9$$
$$r = \frac{S_{xy}}{\sqrt{S_{xx}S_{yy}}} = \frac{12.1}{\sqrt{32.9×38.9}} = 0.338$$
This means thats these two data sets have a weak positive correlation
Example 3
Knowing that the values for x represent the head and body length of doormice and that the values for y represent the tail length of doormice and are recorded in metres
Finally given the information that:
$$S_{xy} = 416.3,$$
$$S_{xx} = 1280.55,$$
$$S_{yy} = 282.8$$
Part a
Calculate the value of the product moment correlation coefficient between x and y
$$r = \frac{S_{xy}}{\sqrt{S_{xx}S_{yy}}} = \frac{416.3}{\sqrt{1280.55×282.8}} = 0.69$$
Part b
Interpret the r value in the context of this question
From the r value we can see that there is a moderate positive correlation between 'head and body length' and the 'tail length' of doormice
Part c
Write down the value of the product moment correlation coefficient if the measurement had been recorded in centimetres
The 'pmcc' would still be 0.692, since a change of units has no effect on the calculation
Part d
Why is it not generally advisible to calculate the value of 'pmcc' without first viewing a scatter diagram of the data. Illistrate answer with the use of a sketch
Three reasons that it would be a good idea to first draw a sketch is the existance of:
Outliers
Non linear relationships
Multiple linear relationships
e.g. Curved so no 'pmcc' can be made
e.g. Shows more than 1 relationship so 'pmcc' would be misleading